Emotion Analysis of a Political Survey: Uttar Pradesh( India)
In the current rage of political festival, Uttar Pradesh election in India holds a really important role. Every party involved, are fighting with their maximum capacity to capture this largest and most diverse demographic state. Here, I have used a small survey by reporters from National Dastak doing survey at the ground level, joined some samples from videos and did emotion analytics using Microsoft API to get a snapshot of Muslims support in some of the important political districts.
Important places that came up in the survey of Eastern UP:
Maharajganj, Kushinagar, gorakhpur, Azamgarh, Mau, Baliya
First, step is to take covert the video to the required quantitative information that involves frame by frame emotion detection with relative degree of probability. I have used Microsoft Emotions API to get the required analyzed data.
Getting the feel of the data.
## converting long format
f_long <- f %>% gather(emotion, value, neutral:contempt)
glimpse(f_long)
## Observations: 347,664
## Variables: 9
## $ start <int> 215, 215, 215, 215, 215, 215, 215, 215, 215, 215, 215,...
## $ id <int> 0, 1, 0, 1, 0, 1, 0, 1, 0, 1, 0, 1, 0, 1, 0, 1, 0, 1, ...
## $ x <dbl> 0.534375, 0.593750, 0.532812, 0.592188, 0.529688, 0.58...
## $ y <dbl> 0.261111, 0.269444, 0.261111, 0.269444, 0.266667, 0.27...
## $ width <dbl> 0.0500000, 0.0437500, 0.0500000, 0.0437500, 0.0500000,...
## $ height <dbl> 0.0888889, 0.0777778, 0.0888889, 0.0777778, 0.0888889,...
## $ frames <int> 1, 1, 2, 2, 3, 3, 4, 4, 5, 5, 6, 6, 7, 7, 8, 8, 9, 9, ...
## $ emotion <chr> "neutral", "neutral", "neutral", "neutral", "neutral",...
## $ value <dbl> 0.987308, 0.913056, 0.998387, 0.909598, 0.996075, 0.83...The data is really chaotic as far as face detection is concerned as the survey was done live and raw. Just to give the glimpse of how face were detected, I have included “face positions plot”.
Total number of face detected in Video: 95
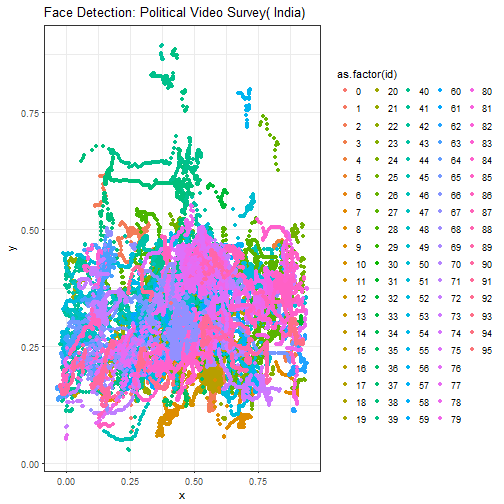
It is clear from the plot that face positions are very chaotic and noisy. So, here I have tried to capture the bigger picture, that is what is the combined sentiment of the crowd of the sampled video.
Emotions detected in the Video
## `geom_smooth()` using method = 'gam'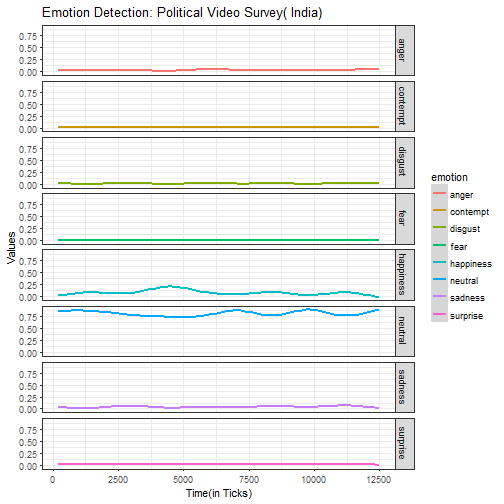
To get a better relative sense, frame by frame:
Removing neutral emotion and gathering frame by frame.
## `geom_smooth()` using method = 'gam'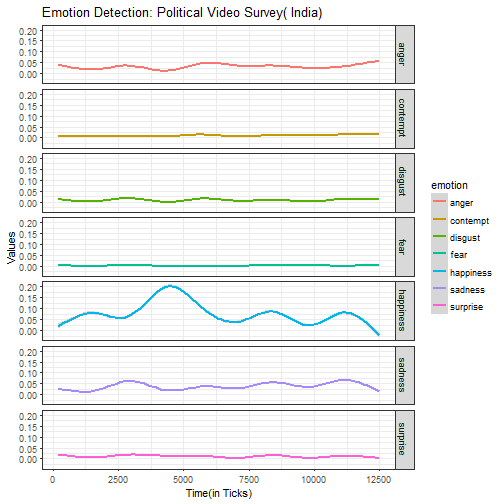
Now, to sum it up let’s have a look at bar plot which brings the clarity about which emotion dominated throughout the survey.
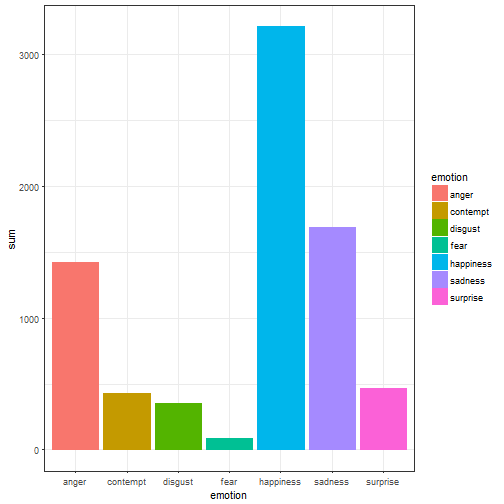
Although, it is difficult to give the final verdict based on limited and raw survey where the video is being captured in an unplanned setting, however it might come to our help that using analytics we can locate the “time stamp”” of interesting show of emotions and with additional minimal manual touch, it gives a good picture of the target audience about the given topic.
In this case, I checked all the interesting show of emotions, like
- people were generally taking the interview lightly and hence the higher values of “happiness”.
- BSP( regional UP party) was mostly mentioned in the happy time slot.
- There were visible show of “anger” and “disgust” against the SP( samajwadi party).
- No mention of BJP (Bhartiya Janta Party), by the people.
Final Verdict
Based on the help provided by the “Emotion analytics” and some manual labor, Muslims are mostly inclined towards BSP in Maharajganj, Kushinagar, gorakhpur, Azamgarh, Mau, Baliya political constituency.